what it is2.3
Side by Side
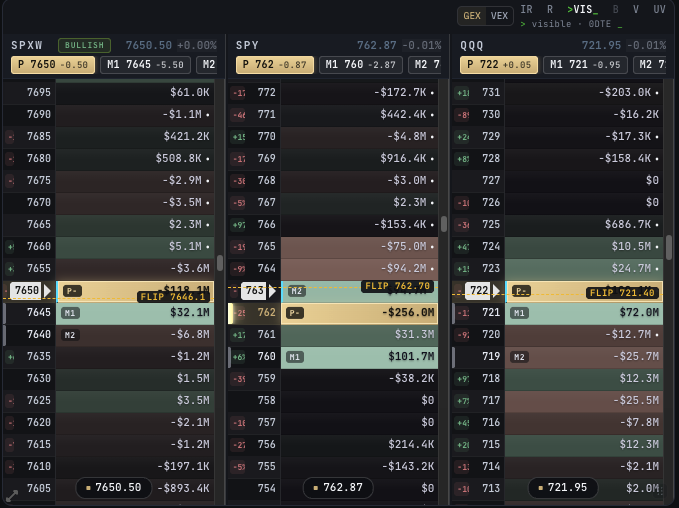
The three books — SPXW, SPY and QQQ — as three ladders next to each other, one strike per row, so you can see where dealer positioning is heavy in each and whether the three agree. It is the widget the rest of the console points back to: the Chart draws its levels from the same nodes, Active Levels lists them, Metrics summarizes them.
ladder view · mid-session · real captureclick a number
anatomy1–12 of 24
1
Column header
The book’s symbol, its bias word when the console has a fresh read, the current price and the day’s change.
2
GEX │ VEX
Which exposure the cells show. GEX is the default and what this guide describes; VEX is the vanna view with fixed blue / orange colors.
3
Lens selector
Six stops, IR · R · VIS · B · V · UV, the active one spelled out beside it. VIS is the default and the one to learn first. Changing it changes every ladder on the console.
4
Node chips
P 7650 −0.50, M1, M2: the primary and two major nodes with their distance from spot. Hover for which side’s flow is leading.
5
Strike column
One strike per row. Drag along it to open the spotlight.
6
Value cells
The dollar figure of dealer exposure at that strike, colored by your heatmap palette. Bigger and brighter is more.
7
Primary node row
The largest node in that book. Solid gold cell, thick gold rail, a slow breathing glow. Flashes three times when the primary moves.
8
Major node rows
The next two largest, M1 and M2, with a thinner silver rail.
9
Rate-of-change chip
A green or red percentage left of the strike when exposure there changed by 5% or more over the chosen interval. Stays up to five minutes.
10
FLIP line
Dashed amber, labeled with the level where the sign of aggregate dealer gamma changes. Can be turned off.
11
P+ / P− and M badges
The primary’s badge carries its sign — positive or negative node. Majors carry M1 / M2 only.
12
Price pill and row
The current price, repeated at the bottom of each column; the row itself has the cyan edge and ▶ pip. The ladder stays centered on it until you scroll.
controls · corner menu
view · ladder / bubblechart · off / onflip · on / offroc · 1m 5m 15m 30m offnodes colored · off 5 10 20
Nodes colored sets how many of the largest nodes keep their color — off, 5, 10 or 20; the rest go dark, the primary and majors always stay lit. Several copies can sit on one console, each with its own settings. The lens and GEX / VEX are shared by every ladder on the console. Default size 6 × 13 grid cells; it will not shrink below readable.
through the day
The ladders update every few seconds while the market is open. Before the open they show the last state of the previous session. After the bell they freeze on the closing landscape and the day-change badge grays; the ladders don't go blank. If the feed drops, the widget says Awaiting GEX data… and reconnects on its own.
what it is not
Not a quote board and not an order book. The value in a cell is dealer exposure, not volume, and it can read very differently through two lenses on the same strike. A bigger node is not a prediction; it is a place where hedging is concentrated.
← 2.2 flow read
see also · nodemap 2.4 · active levels 2.5 · chart 2.6 · 3.1 3.4 3.5 3.7 3.10
2.4 nodemap →